Projects
In the summer of 2020 I took a class GIS course based in R. I worte some code, and did some cool data science. Here is a collection of links!
Lab 01: Building a project website
- I build a static users site with Github Pages for the first time.
- Learning to combine texts with supplements, such as links and graphs.
- Choosing personal settings of this website.
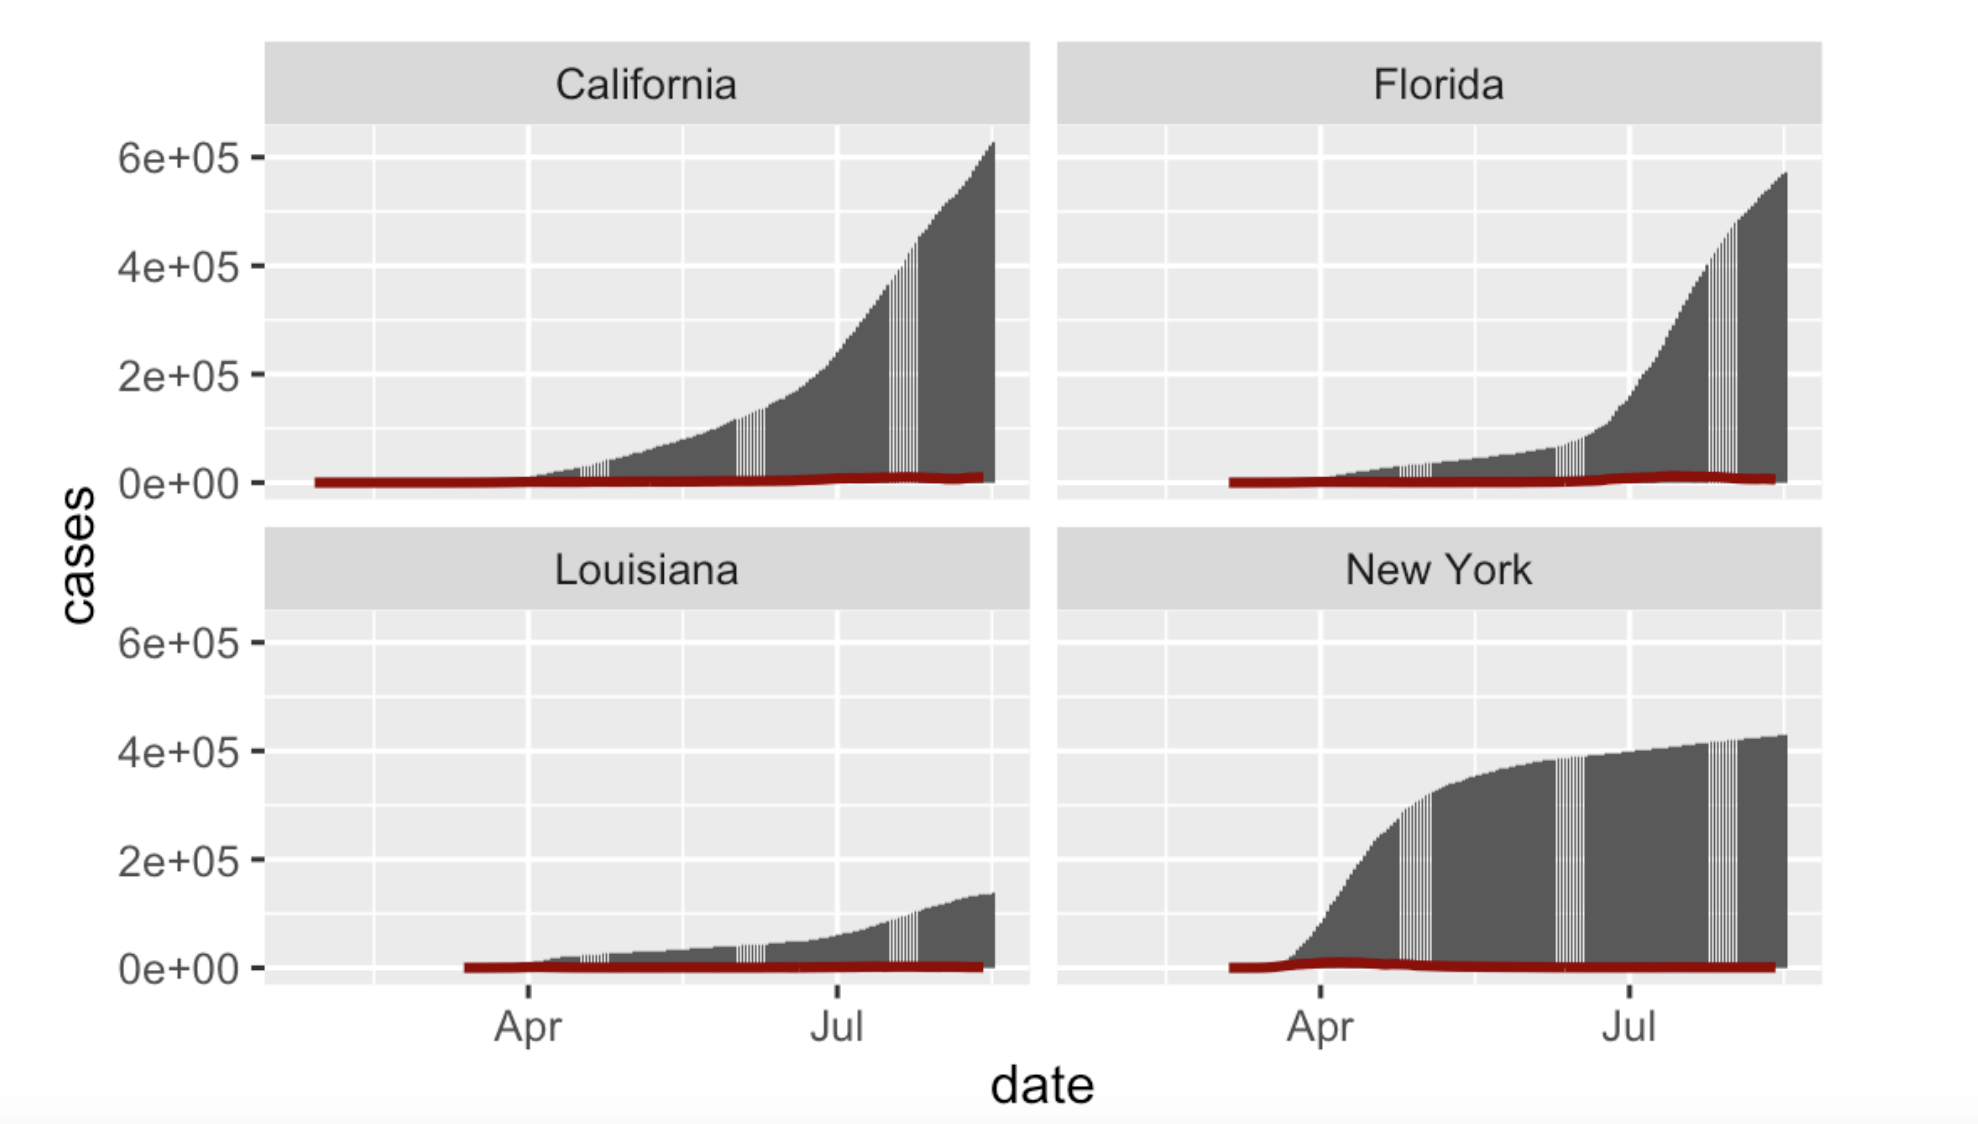
Lab 02: Data Wrangling
- reading in data using readr
- manipulating data and tables
- ggplot to show the result

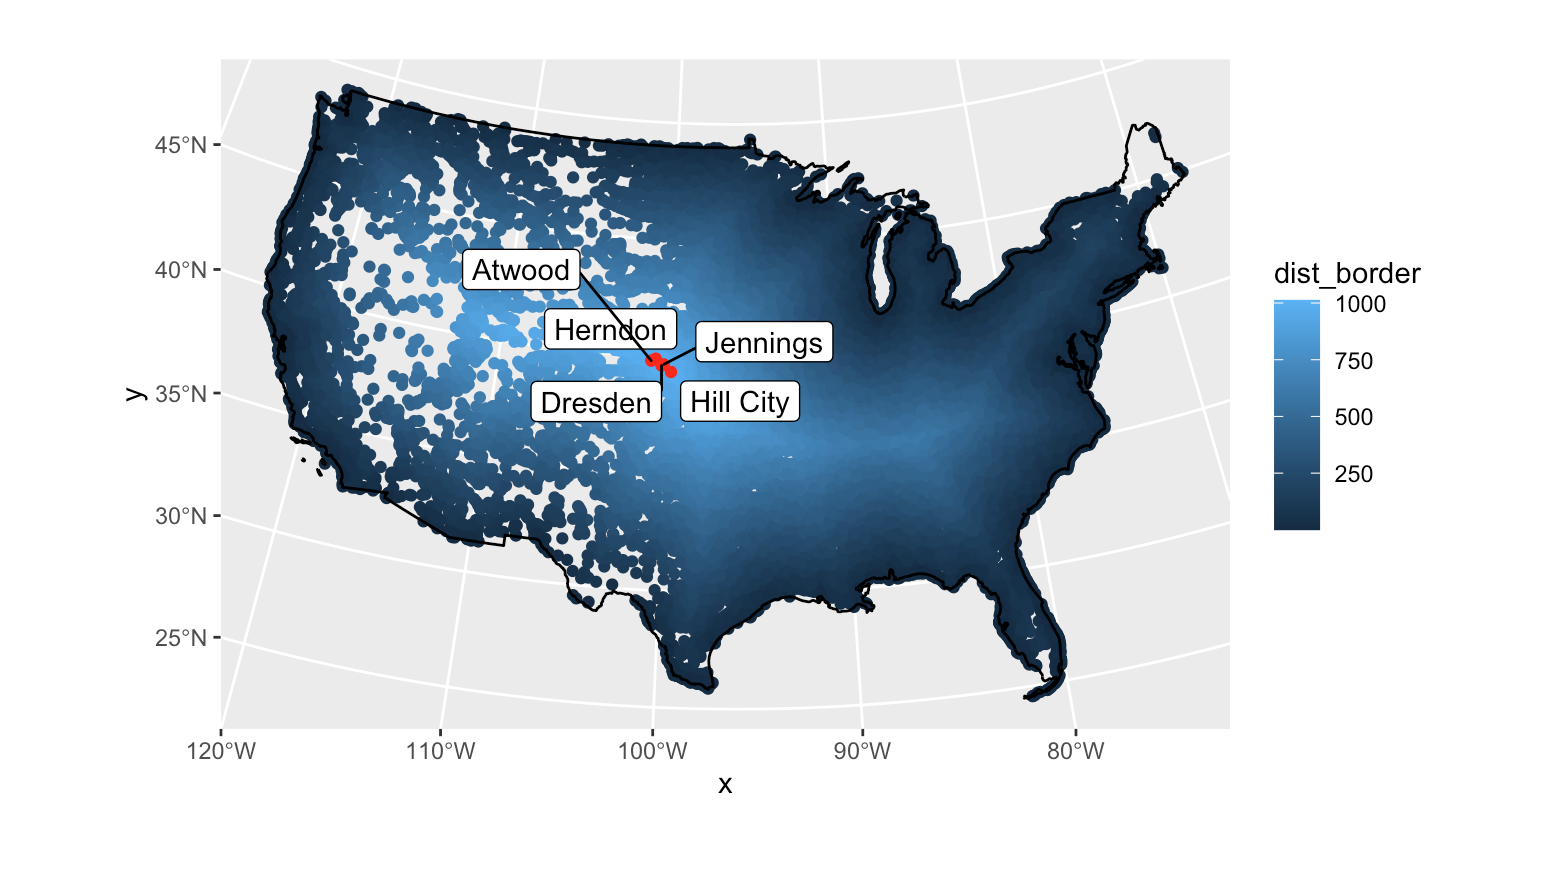
Lab 3: Projections, Distances, and Mapping
- use sf to manipulate data for further edition
- showing the targeted result with gghighlight
- filter the targeted data to analyze the boundry

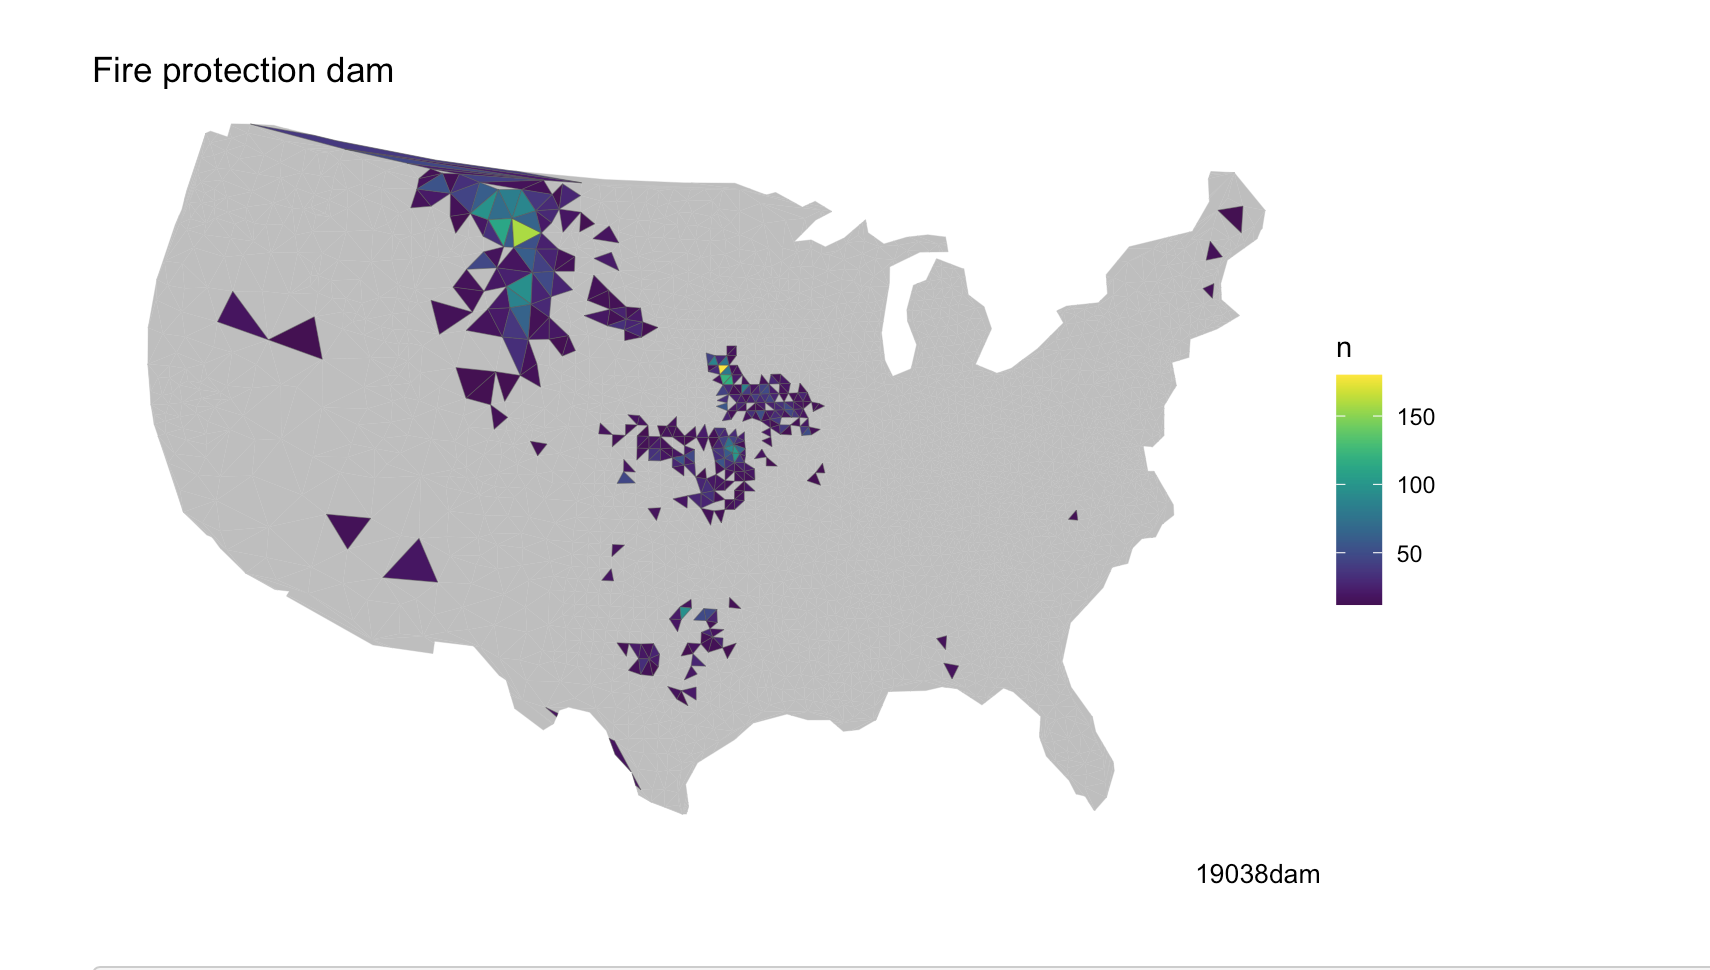
Lab 4: Tesselations, Spatial Joins, and Point-in-Polygon
- make different centroids for different tessellations
- using tessellations to represent different forms
- using the making functions

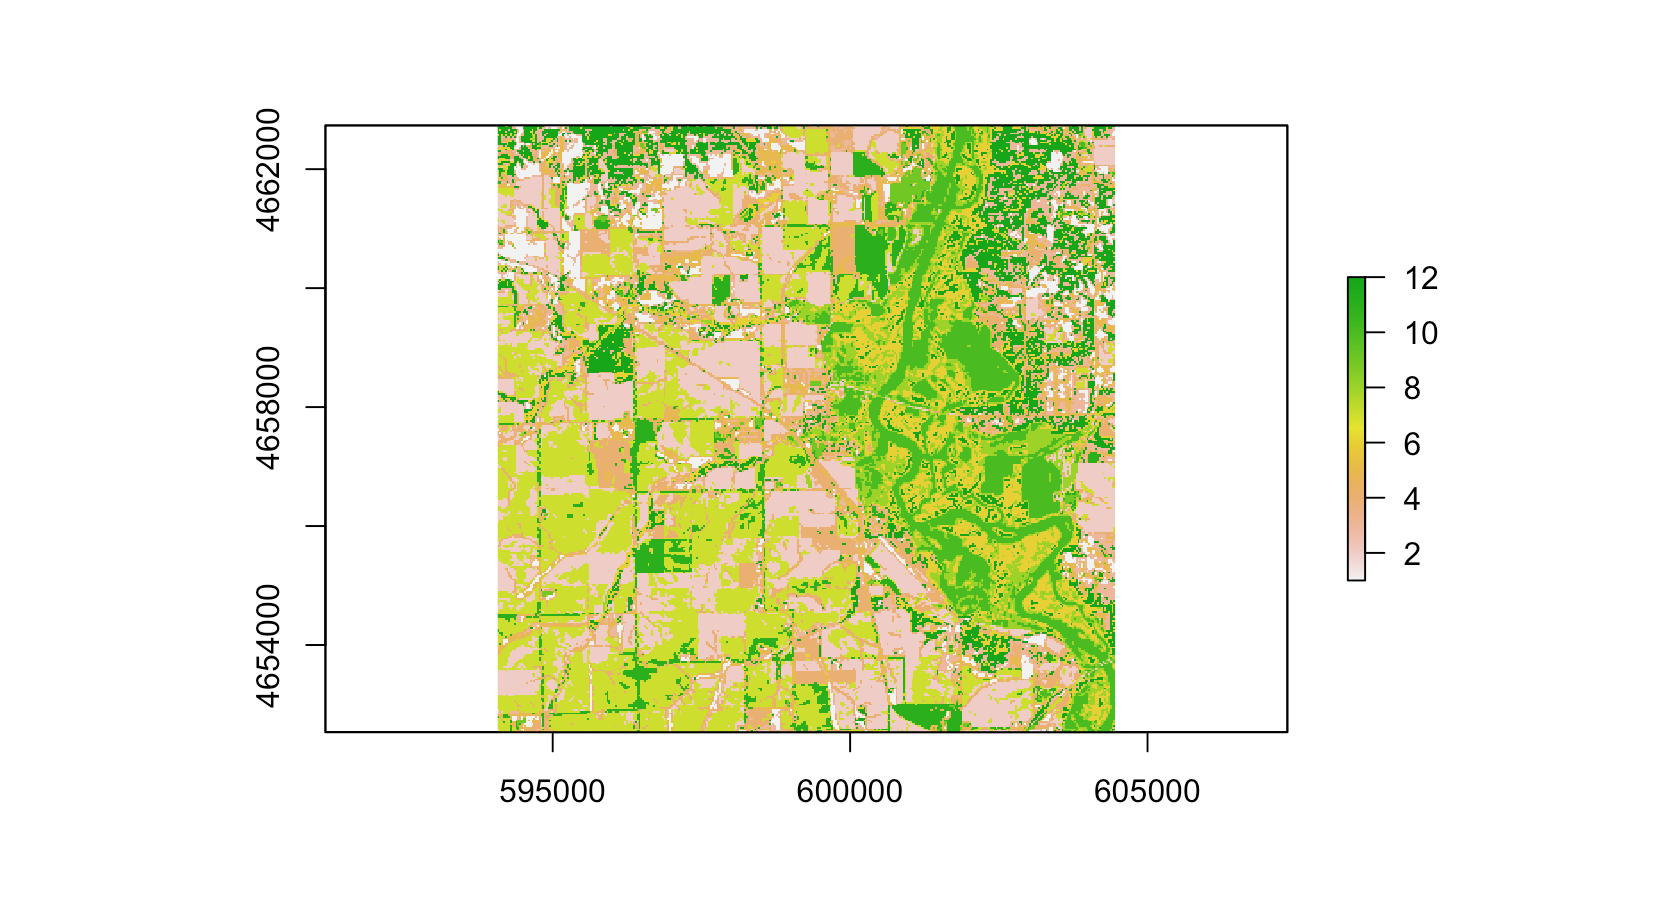
Lab 05: Rasters analysis and Remote Sensing
- combinning the raster data
- showing different forms with various colors
- analyzing kmeans

Lab 06: Terrain Analysis
- open street tools
- using the whitebox tool to draw image
- analyze the real situation of flood
- generating the realistic map